Collecting data is a must for SLPs and teachers in special education. We have to know if IEP speech, language and auditory goals are being met and show progress. In order to choose the best data collection method, it’s important to know what information is needed and whether or not you want to involve the student.
Below are some data collection options. No matter which option you choose, use ten trials with each set of stimuli, and multiply the number of correct responses by ten to calculate the percentage correct.
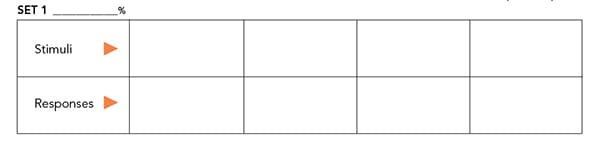
Tally charts – These are a great way to take basic data such as correct and incorrect responses only. Write your stimuli across the top and record the child’s correct responses underneath the stimulus. Use a tally or plus sign for correct responses and an X or minus sign for incorrect ones. You should also note whether the student is asking for repetition and for what stimuli the requests are being made. Frequent requests for repetition can be a sign of uncertainty and should be considered when determining mastery of a skill.
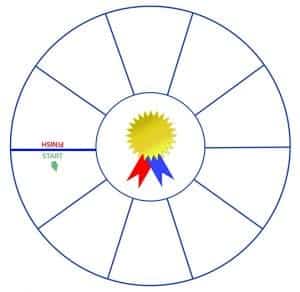
Reward charts – Similar to tally charts, reward charts can be used when you need to record basic data and calculate a percentage correct. With reward charts, the student sees his progress in the data collection process. Use a sticker, draw a smiley face or use a stamp marker for correct responses. For incorrect responses, draw an X, write the stimulus and/or incorrect response, or leave the space blank. Again, you may want to note frequent requests for repetition. Reward charts involve the student and can be motivating. If you don’t have a reward chart handy, then use a stamp marker to stamp a child’s hand for correct responses. Stamp your hand for the incorrect responses. Between the two of you, you can count the number correct responses and of trials to calculate a percentage. Change the stamp marker for a new set of stimuli.
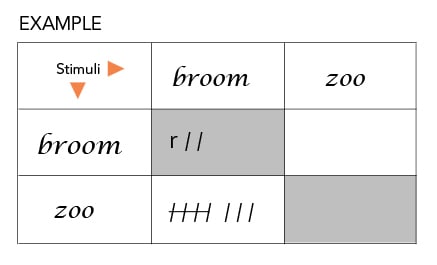
Confusion matrix – A confusion matrix is used to see where the student is confusing the stimuli. This is a good method to use when the student needs to respond to several, similar sounding stimuli, such as with the sounds /p/, /b/, /t/, /k/, with a list of rhyming words, or a consonant perception task, and you need to analyze the errors. In a confusion matrix, write the stimuli across the top. Then in the same order (and that’s the most important part), write the same stimuli down the left side. Present the stimuli ten times and record the child’s correct responses. Count the tally marks and analyze the results.
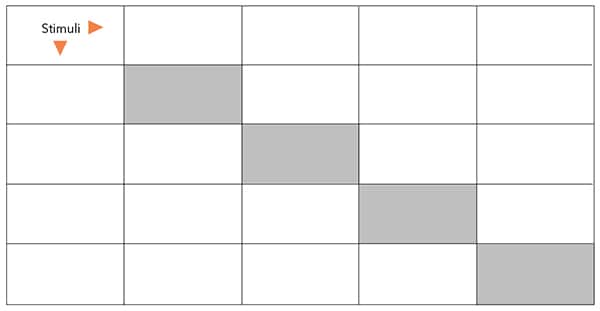
Here is an example of how to record and interpret responses using a confusion matrix. After presenting the stimulus word, broom, mark a tally in the appropriate box in the broom column where the stimulus word and the child’s response intersect. For example, if the child responds with broom, indicate the correct response in the gray box. If the child responds with zoo, mark the white box for zoo in the broom column.
Tally marks in the white boxes indicate that the student is experiencing confusion between the stimuli. In this case, it’s clear that the confusion is because broom and zoo have the same vowel sound.
SLPs and teachers use many ways to collect data, and this list explains just a few. Use what is easiest for you and provides the information you need to know to guide your lessons. Download your free blank data collection sheets on our free download page (under the auditory development category). Please share your favorite methods in the comments.

Jennifer Manley was a teacher of the deaf and associate coordinator of the Emerson Center for Professional Development at Central Institute for the Deaf- CID. Ms. Manley is co-author of the CID SPICE for Life auditory learning curriculum and author of the 2nd Edition CID SPICE auditory training curriculum.